
Seed Companies
SIF measures photosynthetic activity directly, providing earlier and more objective insight into plant performance than conventional vegetation indices. For seed companies running large-scale field trials, that distinction matters: SIF can capture physiological differences between varieties, seed lots and treatments before any visual symptoms appear [1][2].
The phenotyping bottleneck
Conventional germination tests and controlled-environment trials provide useful baselines, but they rarely capture how plants establish and respond to stress under real field conditions [3][5]. A variety that performs well in a growth chamber does not always perform well in a field, and the gap between the two is exactly where commercial risk sits.
At the same time, the demands on breeding are rising. Cereal grain yields are projected to need an increase of at least 70 percent before 2050, yet annual gains from traditional breeding are no longer sufficient to meet projected demand [6][15]. Developing and releasing a single new variety typically takes a decade or more, a timeline that makes every phenotyping decision count [15]. Phenotyping remains the most laborious and technically challenging bottleneck in the breeding process, with most programmes making only a single final-yield measurement per plot across multiple seasons [6]. A single end-of-season number integrates everything that happened to the crop, but it reveals nothing about which physiological process was the limiting factor, or when.
There is also a blind spot in how varieties are selected. Cultivated crops bred for higher yield have, as an unintended side effect, often become more susceptible to water stress, so a variety that looks like an improvement on paper can be more fragile in a dry season [7]. Catching that fragility early means measuring how a plant actually functions under field stress, not just how much it yields at harvest.
Physiology measured directly, before symptoms appear
SIF addresses this gap because it makes physiological differences visible before structural or visual symptoms appear. High-resolution fluorescence imaging has shown that SIF responds to photosynthetic inhibition and reveals performance differences within crop canopies before reflectance measurements detect any visible change [8][9][10].
In variety development, seed treatment evaluation and field trial validation, this means SIF can pick up differences in vigour, emergence uniformity and early stress response objectively, across large trial plots, rather than relying on visual proxies [11]. Because the signal comes from plant function rather than appearance, it complements existing phenotyping methods instead of duplicating them.
Evidence from the field
Goulas et al. (2017) measured SIF continuously over a winter wheat field across a full growing season, using a tower-based spectrometer pointed at the canopy. Far-red SIF at 760 nm explained 83 percent of the variance in gross primary production using daily averages (r² = 0.83), rising to 93 percent under clear-sky conditions (r² = 0.93). It far outperformed red SIF at 687 nm (r² = 0.34) and NDVI, which saturated early in the season and failed to track canopy dynamics through grain filling. SIF at 760 nm provided a continuous, near-real-time physiological signal across the full growing season, without disturbing the crop [12].
Chen et al. (2019) used satellite SIF to track a severe drought over summer maize fields in North China, finding that SIF declined 9 to 12.5 percent during the drought year while NDVI fell only 4.8 to 8.2 percent. The relationship between SIF and gross primary production (r² = 0.85) was substantially stronger than for NDVI (r² = 0.60), and SIF responded to drought onset earlier and more sensitively than greenness indices [16].
These exact values come from one site and one season of tower-based measurement, so they should be read as an illustrative benchmark rather than a universal figure. The pattern they show, far-red SIF tracking productivity while NDVI saturates, is consistent across the wider literature [13].
High-throughput phenotyping at field scale
Measured at scale, SIF enables high-throughput phenotyping across entire trial plots in a single pass [4][11]. High-throughput chlorophyll fluorescence imaging has already been used to phenotype water-deficit stress tolerance in wheat, allowing breeding lines to be compared objectively at scale [14]. SIF-based high-throughput phenotyping enables earlier go or no-go decisions across more varieties, and shortens the path from candidate to commercial seed.
Key benefits for seed companies
Adding objective physiological measurements to a field trial improves the quality, transparency and comparability of performance data across environments and growing conditions. In practice, SIF gives seed companies four things:
- Objective comparison of lots and treatments, measured from plant function rather than visual scoring.
- Early insight into field performance before visible symptoms appear.
- Faster breeding cycles through scalable, high-throughput phenotyping.
- Stronger and more transparent trial data that is comparable across sites and seasons.
- 1.Damm, A., Paul-Limoges, E., Kükenbrink, D., Bachofen, C., & Morsdorf, F. (2022). Response times of remote sensing measured sun-induced chlorophyll fluorescence, surface temperature and vegetation indices to evolving soil water limitation in a crop canopy. Remote Sensing of Environment, 273, 112957. https://doi.org/10.1016/j.rse.2022.112957
- 2.Pérez-Bueno, M. L., Pineda, M., & Barón, M. (2019). Phenotyping Plant Responses to Biotic Stress by Chlorophyll Fluorescence Imaging. Frontiers in Plant Science, 10, 1135. https://doi.org/10.3389/fpls.2019.01135
- 3.Krämer, J., Siegmann, B., Castro, A. O., Muller, O., Pude, R., Döring, T., & Rascher, U. (2025). Downscaling the full-spectrum solar-induced fluorescence emission signal of a mixed crop canopy to the photosystem level using the hybrid approach. Remote Sensing of Environment, 324, 114739. https://doi.org/10.1016/j.rse.2025.114739
- 4.Mayo, A., Vitrack-Tamam, S., Moshelion, M., & Liran, O. (2024). Integrating solar induced fluorescence with high throughput plant screening for advanced phenotyping of plants. Smart Agricultural Technology, 9, 100642. https://doi.org/10.1016/j.atech.2024.100642
- 5.Mangalraj, P., & Cho, B.-K. (2022). Recent trends and advances in hyperspectral imaging techniques to estimate solar induced fluorescence for plant phenotyping. Ecological Indicators, 137, 108721. https://doi.org/10.1016/j.ecolind.2022.108721
- 6.Furbank, R. T., & Tester, M. (2011). Phenomics: technologies to relieve the phenotyping bottleneck. Trends in Plant Science, 16(12), 635–644. https://doi.org/10.1016/j.tplants.2011.09.005
- 7.ESA (2015). Report for Mission Selection: FLEX. ESA SP-1330/2, European Space Agency, Noordwijk, The Netherlands.
- 8.Rossini, M., Nedbal, L., Guanter, L., Ač, A., Alonso, L., Burkart, A., et al. (2015). Red and far red Sun-induced chlorophyll fluorescence as a measure of plant photosynthesis. Geophysical Research Letters, 42(6), 1632–1639. https://doi.org/10.1002/2014GL062943
- 9.Pinto, F., Damm, A., Schickling, A., Panigada, C., Cogliati, S., Müller-Linow, M., et al. (2016). Sun-induced chlorophyll fluorescence from high-resolution imaging spectroscopy data to quantify spatio-temporal patterns of photosynthetic function in crop canopies. Plant, Cell & Environment, 39(7), 1500–1512. https://doi.org/10.1111/pce.12710
- 10.Rascher, U., Alonso, L., Burkart, A., Cilia, C., Cogliati, S., Colombo, R., et al. (2015). Sun-induced fluorescence: a new probe of photosynthesis. First maps from the imaging spectrometer HyPlant. Global Change Biology, 21(12), 4673–4684. https://doi.org/10.1111/gcb.13017
- 11.Salattna, S. UAV-based Imaging of Multispectral Reflectance and Solar-Induced Chlorophyll Fluorescence for Crop Monitoring. University of Bonn. https://hdl.handle.net/20.500.11811/13578
- 12.Goulas, Y., Fournier, A., Daumard, F., Champagne, S., Ounis, A., Marloie, O., & Moya, I. (2017). Gross Primary Production of a Wheat Canopy Relates Stronger to Far Red Than to Red Solar-Induced Chlorophyll Fluorescence. Remote Sensing, 9(1), 97. https://doi.org/10.3390/rs9010097
- 13.Magney, T. S., Bowling, D. R., Logan, B. A., Grossmann, K., Stutz, J., Blanken, P. D., et al. (2019). Mechanistic evidence for tracking the seasonality of photosynthesis with solar-induced fluorescence. Proceedings of the National Academy of Sciences, 116(24), 11640–11645. https://doi.org/10.1073/pnas.1900278116
- 14.Arya, S., et al. (2024). High-throughput chlorophyll fluorescence image-based phenotyping for water deficit stress tolerance in wheat. Plant Physiology Reports, 29. https://doi.org/10.1007/s40502-024-00783-7
- 15.Xiong, W., Reynolds, M., & Xu, Y. (2022). Climate change challenges plant breeding. Current Opinion in Plant Biology, 70, 102308. https://doi.org/10.1016/j.pbi.2022.102308
- 16.Chen, X., Mo, X., Zhang, Y., Sun, Z., Liu, Y., Hu, S., & Liu, S. (2019). Drought detection and assessment with solar-induced chlorophyll fluorescence in summer maize growth period over North China Plain. Ecological Indicators, 104, 347–356. https://doi.org/10.1016/j.ecolind.2019.05.017
- Is SIF relevant for seed treatment evaluation? +
- Yes. SIF can reveal differences in field establishment, emergence uniformity and early stress response between seed lots and treatments before any visual differentiation occurs. This gives a more objective and earlier basis for evaluating treatment efficacy than visual scoring or final stand counts.
- Does SIF detect stress regardless of its cause? +
- Yes. SIF tracks photosynthetic function, which is suppressed by any physiological stress: drought, heat, waterlogging, disease and nutrient deficiency each produce a measurable response in the fluorescence signal. At canopy scale, SIF gives early warning that a variety or treatment is underperforming before visual symptoms appear, whatever the underlying cause. Identifying the specific cause requires additional agronomic context, but for ranking varieties and treatments objectively and early, the signal is equally informative regardless of cause.
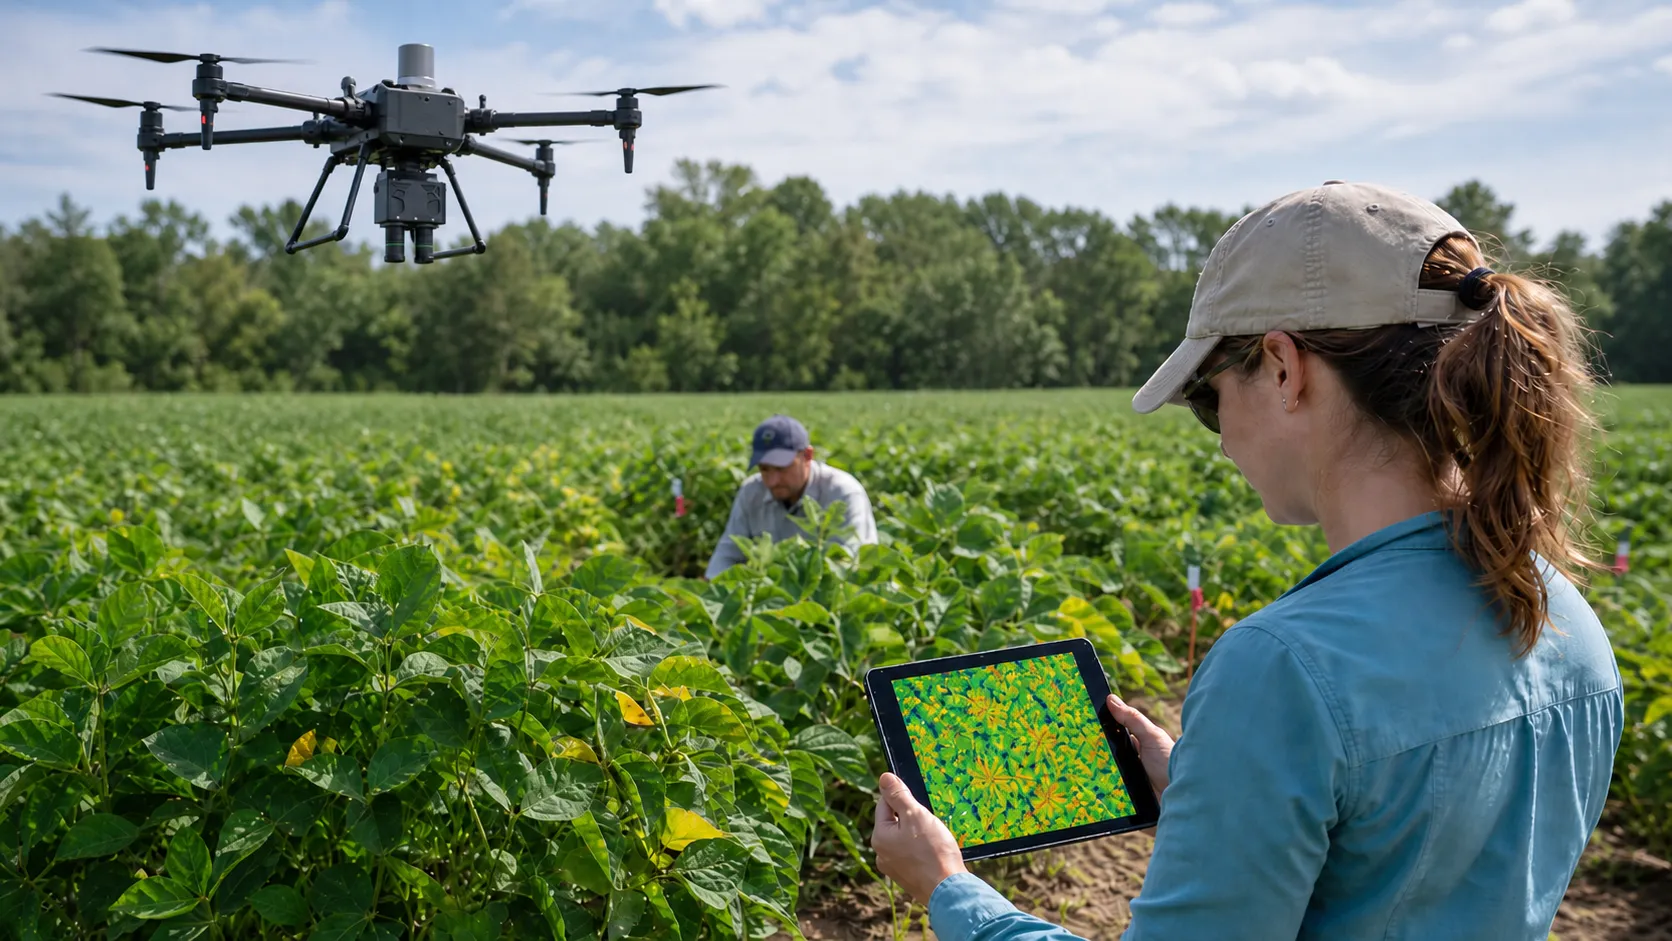
- What scale of trial can be covered? +
- SIF imaging from a drone can cover entire breeding trials in a single flight, extracting plot-level physiological data across hundreds of plots when plot coordinates are available. This is the throughput that turns a physiological trait into a usable ranking across a whole trial. It also replaces the countless hours field technicians would otherwise spend walking plots and collecting chlorophyll fluorescence readings manually.
- How does SIF compare with multispectral phenotyping? +
- Multispectral imaging describes canopy structure through reflectance indices such as NDVI and NDRE. SIF describes physiology through the fluorescence emission of active photosynthesis. The two are complementary inputs to a phenotyping pipeline, and SIF detects functional differences before structural ones become visible.
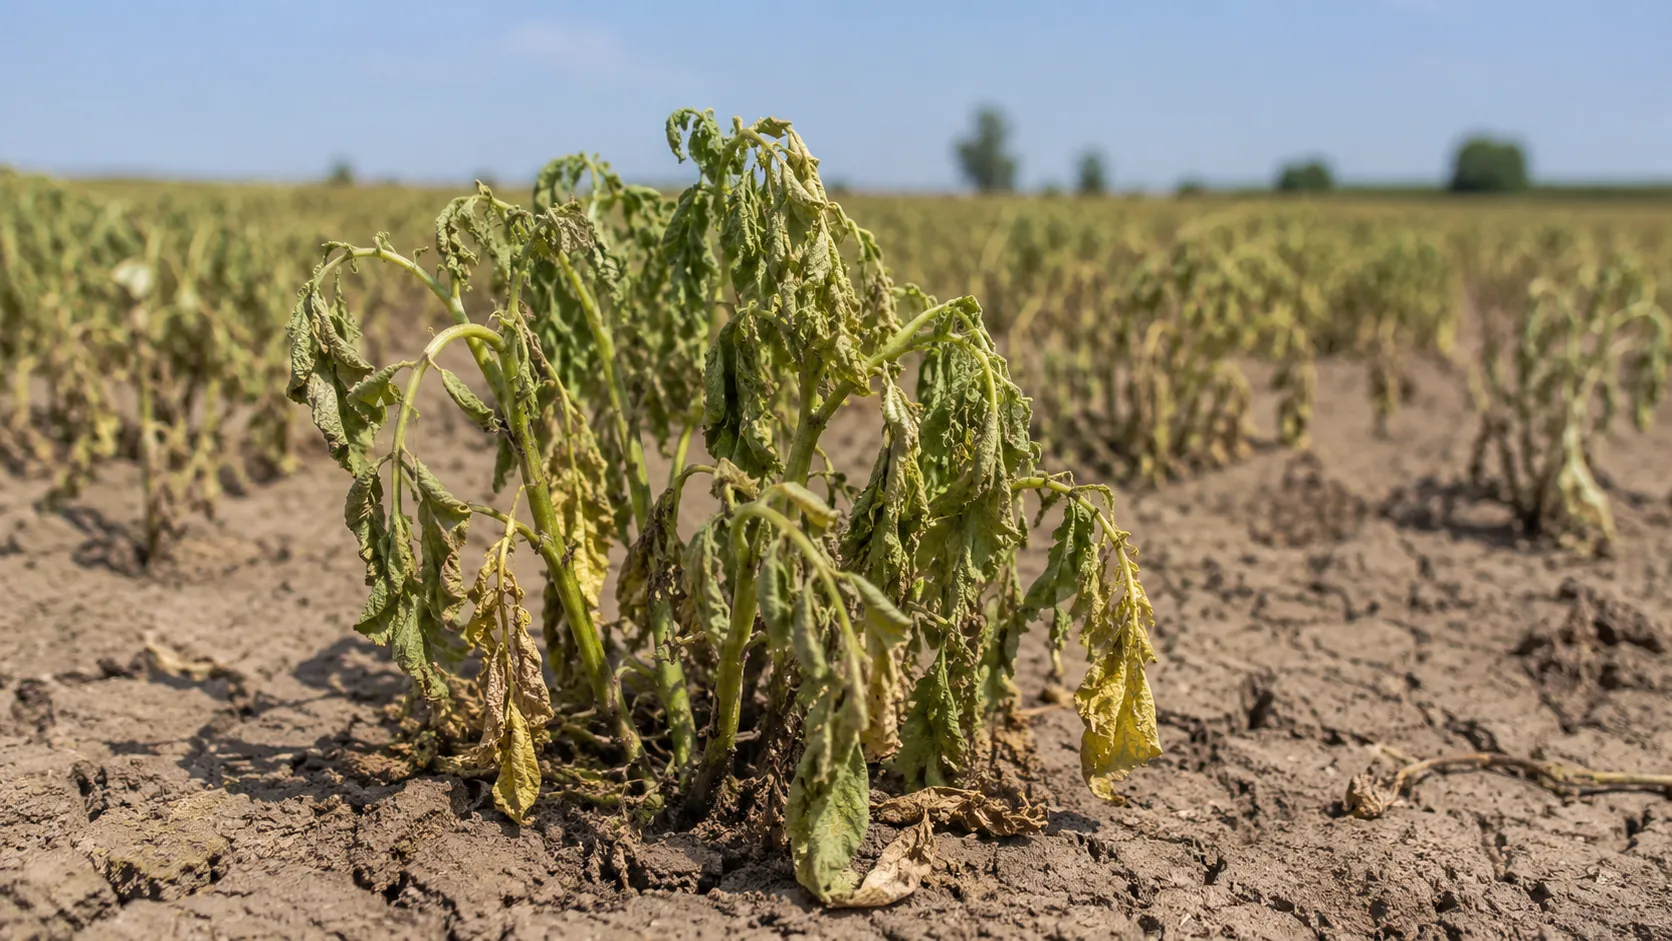
Early Stress Detection
6 minBy the time a crop looks stressed, weeks of yield potential are often already lost. SIF detects the physiological decline that comes first.
How SIFcam Works
7 minSIFcam measures solar-induced fluorescence in the oxygen A-band from a drone, and turns a flight of snapshot images into a single calibrated SIF map.