
How SIFcam Works
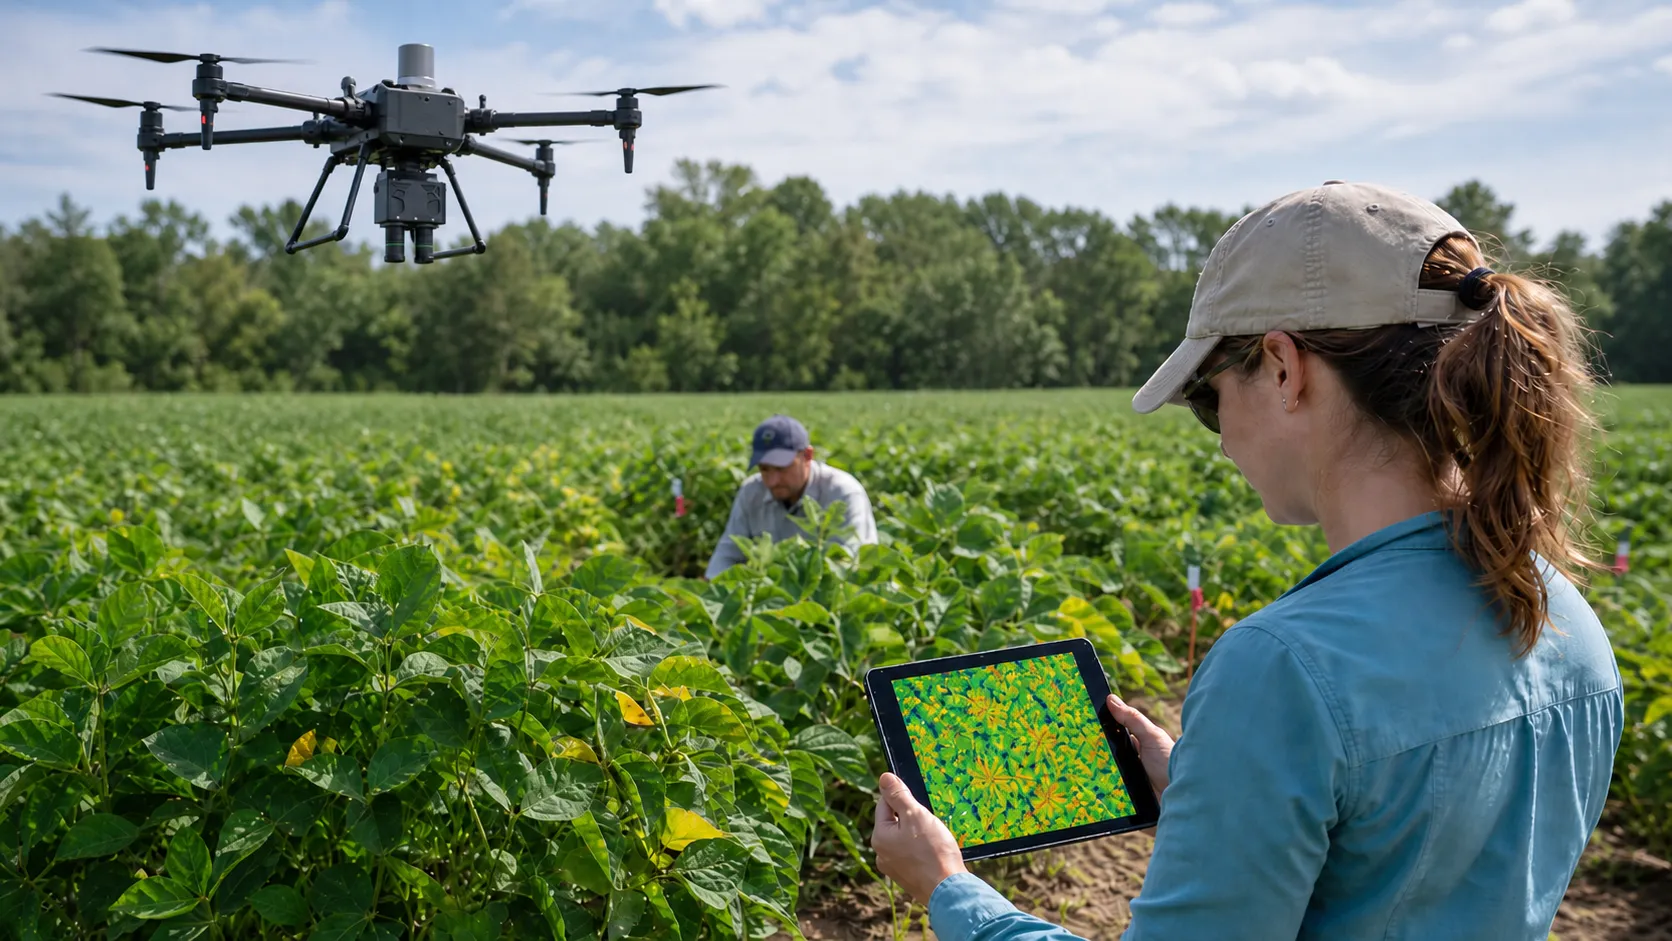
SIFcam is a compact imaging system that measures solar-induced fluorescence from a drone or a tower. This article explains why it targets a very specific part of the spectrum, how it captures the signal in a single snapshot, and how a flight with hundreds of frames becomes a calibrated map ready for analysis.
Why we measure the far-red peak
The fluorescence spectrum emitted by a photosynthesising leaf has two characteristic peaks: a smaller red peak near 685 nm and a broader far-red peak near 740 nm (see figure below). They come from the two protein complexes of the photosynthetic machinery. The red peak is produced almost exclusively by photosystem II, the regulated workhorse where most photoprotection happens. The far-red peak carries contributions from both photosystem II and photosystem I, so it integrates a different and more complete view of canopy photosynthetic activity [1].
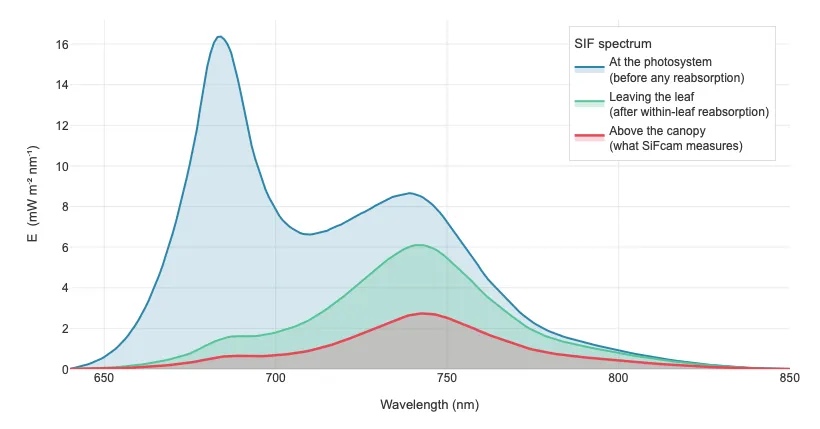
At canopy level the two peaks behave very differently. Chlorophyll absorbs strongly between roughly 640 and 700 nm, exactly where the red peak emits, so light emitted from a leaf deep inside the canopy is largely reabsorbed by the leaves above before it can escape. Above 700 nm chlorophyll absorbs very little, so the far-red peak is essentially transparent to canopy structure and reaches an instrument above the canopy more or less intact [2]. As a result, the surviving far-red signal carries information from the entire productive canopy, not only the sunlit top, and has been shown to track gross primary production more closely than the red peak in field studies, particularly in cereal canopies during active growth [3].
Inside the O₂-A band
Even with the far-red peak as the target, fluorescence is faint, only about 1 to 5 percent of the light leaving a sunlit canopy at the same wavelengths. To separate it from reflected sunlight, an instrument has to look inside a very narrow part of the spectrum where the reflected component is naturally suppressed. The oxygen A-band, a narrow region near 760 nm, provides exactly that window. Oxygen in the atmosphere absorbs incoming sunlight strongly there and leaves a deep, dark feature in the solar spectrum reaching the ground. Against that dark background the plant's emission stands out and becomes measurable [4]. The O₂-A band sits only about 20 nm from the surviving far-red peak, close enough to read it directly. It is the same physical principle, in the same wavelength region, that the European Space Agency's FLEX satellite mission will use to map fluorescence from orbit [1].
SIFcam reports the result in absolute physical units, milliwatts per square metre per nanometre per steradian, rather than as a relative index. Working in physical units is what makes one measurement comparable across flights, sites and seasons, and provides a consistent quantitative basis for downstream analysis, including machine learning.
Snapshot imaging from the air
SIFcam captures a whole scene in a single instant. Rather than building an image up line by line, as a scanning push-broom imaging spectrometer would, it records the full frame at once. The optics are stationary while the frame is taken, with no rotating filter, no scanning mirror, and no moving parts in the imaging path.
That stationary design lets SIFcam acquire calibrated fluorescence frames at rates of up to 10 per second. At that cadence the camera can do more than collect single frames for mapping: it will be able to stream live SIF imagery from a fixed tower, or record short videos that show how photosynthetic activity evolves over a canopy through the day. Every frame still arrives with the position and orientation it was taken at, so the same data can be stitched into a static map after a flight [5].
SIFcam is designed to fly on standard survey drones and can also sit on a fixed tower for continuous monitoring. The retrieval depends on stable sunlight, so it operates in daylight under clear or near-clear skies; acquisitions made under rapidly shifting cloud cover are flagged so they can be treated with appropriate caution.
From single frames to an orthomosaic
From a flight altitude of 25 metres, a single snapshot covers only a small patch of ground, roughly 12 by 12 metres. To map a whole field, the drone flies a planned grid pattern and captures hundreds of overlapping images, each one a small piece of the larger scene.
Those pieces are then assembled into one seamless map. Each frame undergoes a series of pre-programmed corrections, including lens distortion, spectral calibration and radiometric normalisation [6].
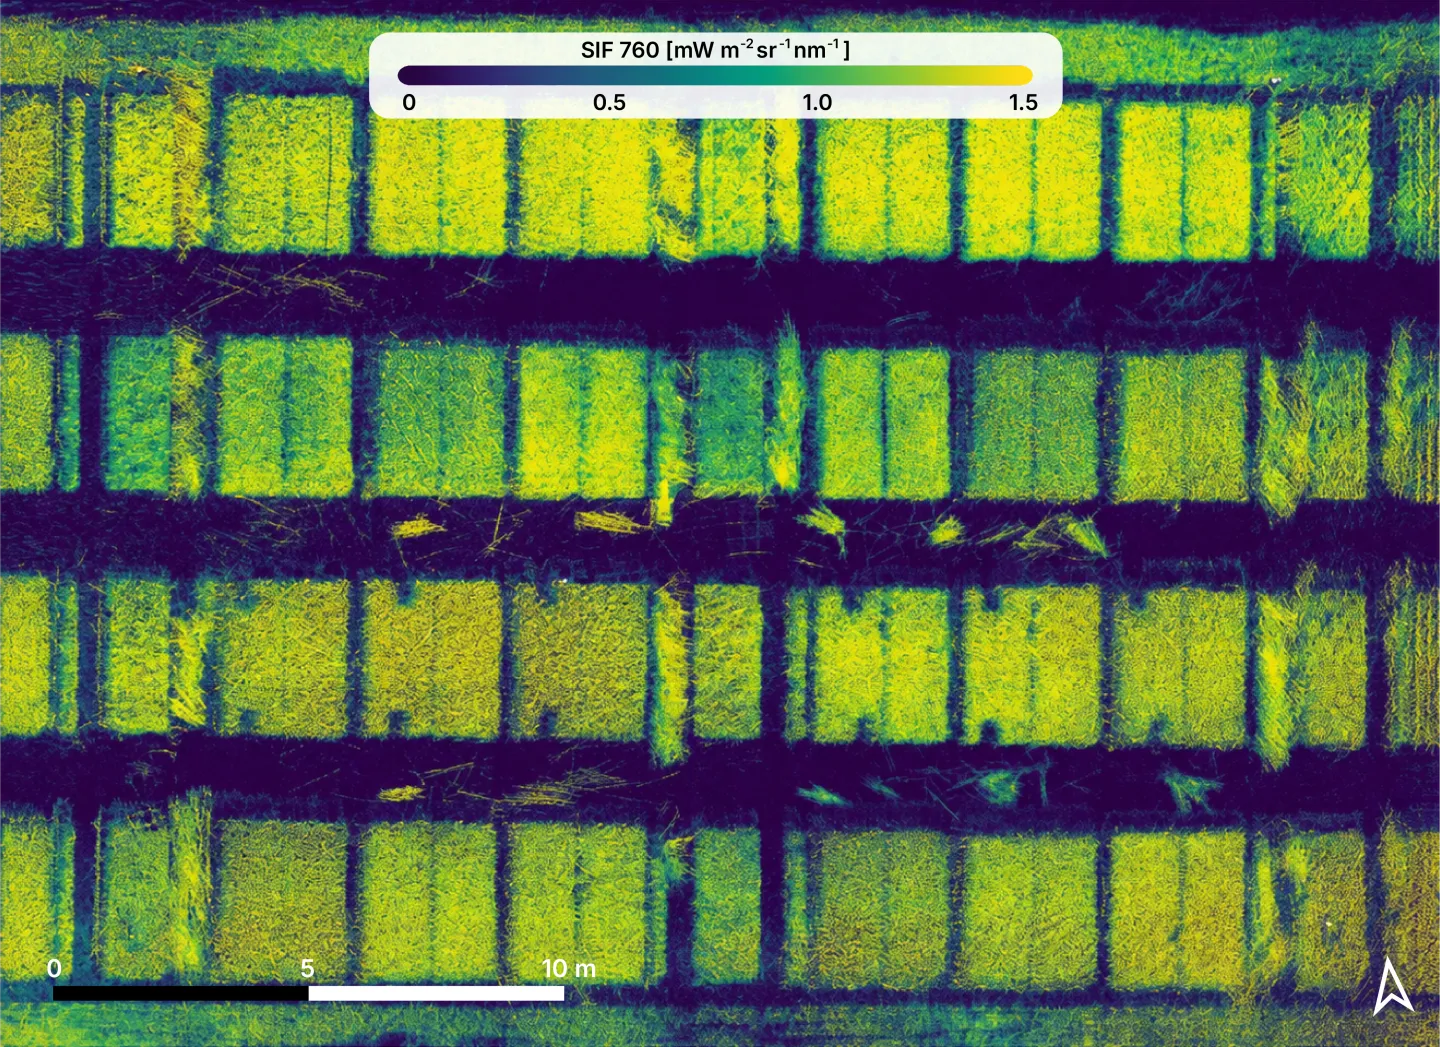
It is then placed onto a common ground reference using the position and orientation recorded in flight. Where frames overlap, they are aligned to one another and blended so that the joins disappear. The result is an orthomosaic: a single, geometrically corrected, georeferenced image of the whole survey area [7].
Because every frame carries a calibrated fluorescence value, the finished orthomosaic is more than a picture. It is a SIF map in physical units, in which each pixel reports the photosynthetic signal at that point on the ground.
A map you can work with
At a flight altitude of 25 metres, a SIFcam orthomosaic resolves detail down to roughly 2.6 centimetres per pixel, fine enough to see variation within a single field or breeding plot.
The orthomosaic is delivered as a standard georeferenced raster, so it drops directly into GIS tools and into farm-management or field-trial software. Plot boundaries can be laid over the map to extract an average SIF value for every plot, turning an image into a table of numbers that is ready for analysis.
Repeating flights over the same area can turn individual maps into a time series, making it possible to observe how fluorescence patterns change over time. Today, SIFcam is most reliable for comparing relative differences within a single acquisition, such as variation between plants or plots under the same illumination conditions. Longer-term comparisons across dates and seasons will become increasingly meaningful as corrections for changing incoming light are further developed.
- 1.ESA (2015). Report for Mission Selection: FLEX. ESA SP-1330/2, European Space Agency, Noordwijk, The Netherlands.
- 2.Porcar-Castell, A., Tyystjärvi, E., Atherton, J., van der Tol, C., Flexas, J., Pfündel, E. E., et al. (2014). Linking chlorophyll a fluorescence to photosynthesis for remote sensing applications: mechanisms and challenges. Journal of Experimental Botany, 65(15), 4065–4095. https://doi.org/10.1093/jxb/eru191
- 3.Goulas, Y., Fournier, A., Daumard, F., Champagne, S., Ounis, A., Marloie, O., & Moya, I. (2017). Gross Primary Production of a Wheat Canopy Relates Stronger to Far Red Than to Red Solar-Induced Chlorophyll Fluorescence. Remote Sensing, 9(1), 97. https://doi.org/10.3390/rs9010097
- 4.Meroni, M., Rossini, M., Guanter, L., Alonso, L., Rascher, U., Colombo, R., & Moreno, J. (2009). Remote sensing of solar-induced chlorophyll fluorescence: Review of methods and applications. Remote Sensing of Environment, 113(10), 2037–2051. https://doi.org/10.1016/j.rse.2009.05.003
- 5.Bendig, J., Malenovský, Z., & Gautam, D. (2020). Solar-Induced Chlorophyll Fluorescence Measured From an Unmanned Aircraft System: Sensor Etaloning and Platform Motion Correction. IEEE Transactions on Geoscience and Remote Sensing, 58(5), 3422–3429. https://doi.org/10.1109/TGRS.2019.2956194
- 6.Zhang, Z. (2000). A Flexible New Technique for Camera Calibration. IEEE Transactions on Pattern Analysis and Machine Intelligence, 22(11), 1330–1334. https://doi.org/10.1109/34.888718
- 7.Elibol, et al. SIFMap: A Python toolbox for creating solar-induced fluorescence maps from UAV-borne snapshot imaging spectroscopy data.
- 8.van der Tol, C., Verhoef, W., Timmermans, J., Verhoef, A., & Su, Z. (2009). An integrated model of soil–canopy spectral radiances, photosynthesis, fluorescence, temperature and energy balance. Biogeosciences, 6(12), 3109–3129. https://doi.org/10.5194/bg-6-3109-2009
- 9.Yang, P., Prikaziuk, E., Verhoef, W., & van der Tol, C. (2021). SCOPE 2.0: a model to simulate vegetated land surface fluxes and satellite signals. Geoscientific Model Development, 14(7), 4697–4712. https://doi.org/10.5194/gmd-14-4697-2021
- Why measure at 760 nm and not at the red peak near 685 nm? +
- Both fluorescence peaks carry photosynthesis information, but only the far-red peak survives the trip out of a closed canopy. Chlorophyll strongly reabsorbs the red emission from leaves below, so by the top of a canopy the red peak is heavily suppressed. The far-red peak escapes almost intact, and the O₂-A band at 760 nm provides the narrow atmospheric window needed to separate it from reflected sunlight.
- What spatial resolution does SIFcam achieve? +
- At a flight altitude of 25 metres, a SIFcam orthomosaic resolves roughly 2.6 centimetres per pixel. 25 metres is the current sweet spot: flying higher lengthens the path of light through the atmosphere and increases oxygen absorption of the signal, while flying lower makes the retrieval more sensitive to height differences within the canopy. We expect higher altitudes to become practical as the processing matures.
- How much area can SIFcam cover in one flight? +
- At the standard 25-metre flight altitude, a single battery covers roughly 2 hectares. Larger areas are mapped by combining several battery swaps into one survey.
- Does SIFcam need a special drone? +
- SIFcam is designed to fly on standard survey UAVs and can also be mounted on a fixed tower for continuous, stationary monitoring. Tight integration with RTK GPS for precise georeferencing is currently available on the DJI M400; SIFcam can still be flown on other platforms when that level of positioning is not required. We are actively working on extending RTK integration to further platforms, so reach out if you would like to fly SIFcam on something other than the M400.
- Can SIFcam measure on a cloudy day? +
- SIF needs sunlight to excite the chlorophyll, so SIFcam currently operates best under clear or near-clear skies. Broken cloud cover changes the incoming light faster than the measurement can compensate for, and acquisitions made under such conditions are flagged so they can be treated with caution. We are actively working on improving reliability under cloudy conditions.
- What file format does the SIF map come in? +
- The orthomosaic is delivered as a GeoTIFF, a standard georeferenced raster format that opens directly in GIS tools such as QGIS and ArcGIS as well as in field-trial and farm-management software that accept georeferenced layers.
What is SIF?
7 minSolar-Induced Fluorescence is the faint light that every photosynthesising leaf emits under sunlight. It is the most direct optical signal of active photosynthesis measurable from a distance.
Validation
6 minEvery SIFcam measurement is tied to absolute physical units and cross-validated against established reference instruments such as FloX and HyPlant.